What is multiomics?
Research Article
Multiomics analyses of well-studied diseases can reveal molecular pathways, identify biomarkers, and improve predictive models.


Summary
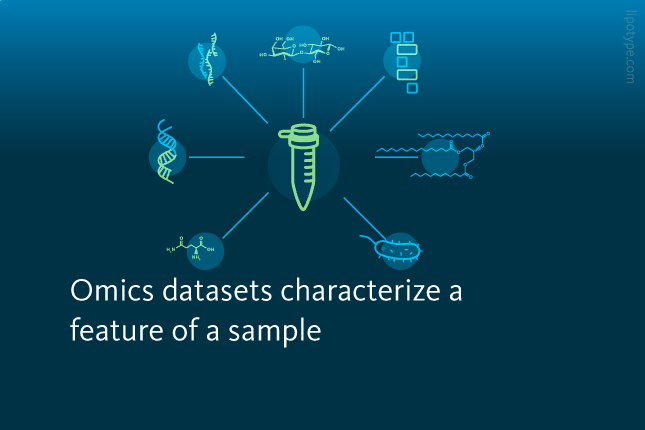
• Omics datasets characterize a specific feature of a sample
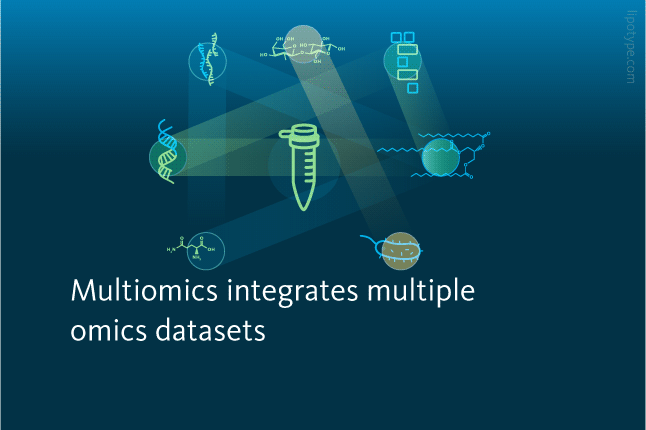
• Multiomics integrates the analysis of multiple omics datasets
• Multiomics analyses that include the lipidome can identify links in physiological and pathological processes
Resources
An integrative multi-omics approach reveals…
Clark et al. | Alz Res Therapy (2021)
LDLR-mediated lipidome–transcriptome…
Chang et al. | ERC (2020)
Multi-omics insights into functional alterations…
Backman et al. | MolMet (2019)
Genetic architecture of human plasma…
Tabassum et al. | Nat Commun (2019)
An automated shotgun lipidomics platform…
Surma et al. | EJLT (2015)
Mouse lipidomics reveals inherent flexibility…
Surma et al. | SciRep (2021)
Systematic screening for novel lipids by…
Papan et al. | Anal. Chem. (2014)
IN recent years, the production and analysis of so-called omics datasets has rapidly gained popularity in biomedical research. Omics datasets are libraries characterizing a specific biological feature – such as the genes, lipids, proteins, metabolites, or microbes – of an organelle, cell, tissue, or organism.

Number of omics publications since 1990: The number of annual publications which mention genomic, transcriptomic, proteomic, metabolomic, glycomic, lipidomic, or microbiomic continuously increased from about 2,300 publications in 1990 to about 52,000 publications in 2021.
PubMed.gov
The lipidome, the identity and concentration of all lipid species in a biological sample, can be characterized via mass spectrometry, in a process known as lipidomics. Recent studies indicate that lipidome data can provide insight on many biological phenomena, including molecular mechanisms underlying disease, biophysical properties of cellular membranes, and population health.
Individual analysis of an omics dataset can identify links between the characterized feature and a specific biological phenomena. For example, lipidomic characterization of human skin samples revealed that the organ’s composition, and perhaps function, vary with location on the body, sex, and age.

Moreover, multiomics is the integrated analysis of multiple omics datasets, can identify mechanisms of action, biomarkers, networks, pathways, and other relationships present in physiological and pathological processes. Multiomics analyses have been used to characterize, monitor, and predict many disease states.
The following case studies describe recent multiomics-based studies of four common diseases – namely, Alzheimer’s disease, cardiovascular disease, type I diabetes, and ovarian cancer – in which inclusion of lipidome data helped reveal something new about well-studied diseases.
Profiling of Alzheimer’s disease
Alzheimer’s disease is a progressive neurodegenerative disorder affecting an estimated 60-70% of the world’s dementia patients. Alzheimer’s disease develops when – despite protective features in the brain like bone, cerebrospinal fluid, and glia cells – neurons accumulate damage, including loss of communication functions.

Study design schematic: Graphical outline of the multiomics cohort analysis of central nervous system pathway alterations in Alzheimer’s disease.
The causes of and signaling pathways involved in Alzheimer’s disease remain largely unknown, hindering diagnostic and therapeutic efforts. To address this gap in the literature, a 2021 study compared molecular signatures of cerebrospinal fluid to clinical evaluations in a population.
120 patients were categorized into control, mild cognitive dysfunction, and Alzheimer’s disease groups based on the results of psychiatric evaluation and known protein biomarkers in cerebrospinal fluid. The proteome, metabolome, lipidome, one-carbon metabolome, and neuroinflammatory markers were also characterized.
 and cognitive decline (blue, right graph). For comparison, the reference model including APOE status information (green, both graphs) has been added.")
Regression models to improve clinical prediction of Alzheimer’s disease: AUC curves for the final prediction models obtained after addition of the four respective analytes selected by the MOFA model of Alzheimer’s pathology (blue, left graph) and cognitive decline (blue, right graph). For comparison, the reference model including APOE status information (green, both graphs) has been added.
Clark et al., Alz Res Therapy (2021), doi: 10.1186/s13195-021-00814-7
Individual analyses of the five omics datasets identified 82 molecules that correlated with one of the two protein biomarkers for Alzheimer’s disease. Subsequent multiomics analyses revealed four-molecule combinations that not only correlate with clinical markers of Alzheimer’s disease but also improve the sensitivity and specificity of predictive models.
An additional multiomics analysis of heterogeneity identified five latent factors that account for variance in the dataset. These latent factors capture information from all five omics datasets and may be representative of molecular signaling pathways involved in Alzheimer’s disease, such as neuronal injury and amyloid pathology.
 within the cohort explained by (A) each analytical approach and (B) latent factors.")
Multiomics Factor Analysis: Overview of the trained Multiomics Factor Analysis model showing variance (R2) within the cohort explained by A each analytical approach and B latent factors.
Clark et al., Alz Res Therapy (2021), doi: 10.1186/s13195-021-00814-7
Through multiomics analysis of proteome, lipidome, metabolome, one-carbon metabolome, and neuroinflammatory marker datasets, this study identified new individual and sets of molecules that correlate with Alzheimer’s disease. These findings supported the development of a specific and sensitive disease prediction model which can be tested in populations representing multiple stages of Alzheimer’s disease.
Cancer chemotherapy sensitivity
Cancers occur when tissue- or organ-specific cells accumulate deleterious mutations and begin to rapidly grow at the expense of the host. Though the availability and efficacy of cancer therapies – including surgery, radiation, chemotherapy, and immunotherapy – have improved dramatically in the last several decades, predicting which patients will respond to which therapies remains challenging.

Recent research demonstrates a role for lipids in cancer development and progression: for example, lipid homeostasis has been linked to breast cancer progression. Building on this work, a 2020 report examined the relationship between the lipidome and chemosensitivity in four subtypes of ovarian cancer – namely, serous, mucinous, endometrioid, and clear-cell – treated with the platinum-based chemotherapy cisplatin.
Lipidomic, transcriptomic, chemosensitivity, and related data were collected from a series of ovarian cancer models that included cell lines, murine models, patient samples, and The Cancer Genome Atlas.
 Immunohistochemistry staining of LDLR. (B) Quantitation of Immunohistochemistry scores (IHC scores) of LDLR. The patient numbers are serous (S, n = 16), mucinous (M, n = 29), endometrioid (E, n = 50), and clear-cell (C, n = 20). ‘Strong’ indicates an IHC score of 3 or above; ‘weak’ indicates an IHC score lower than 3.")
LDLR expression in ovarian cancer subtypes: A Immunohistochemistry staining of LDLR. B Quantitation of Immunohistochemistry scores (IHC scores) of LDLR. The patient numbers are serous (n = 16), mucinous (n = 29), endometrioid (n = 50), and clear-cell (n = 20). ‘Strong’ indicates an IHC score of 3 or above; ‘weak’ indicates an IHC score lower than 3.
Chang et al., ERC (2020), doi: 10.1530/ERC-19-0095
The results showed that high expression of low-density lipoprotein (LDLR) – observed in clear-cell and endometrioid cells – is associated with lower chemosensitivity. LDLR is a cell surface receptor that transports low-density lipoprotein. Chemosensitivity was restored by knocking down LDLR expression.
A multiomics analysis of lipidome and transcriptome data revealed the mechanism underlying this observation: high expression of LDLR upregulates expression of the phospholipase FAM83B, which subsequently increases expression of the FGF receptor family. Activation of this signaling axis reduces ovarian cancer’s responsiveness to cisplatin.
 Reduction of FAM83B mRNA and FGFR3 mRNA expression in endometrioid (MDAH-2774) and clear-cell (TOV-21G) ovarian cancer cell lines after LDLR-knockdown (shLDLR). (B) Tumor-suppressive effect of cisplatin (6 mg/kg/mice) in xenograft mouse models.")
LDLR → FAM83B → FGFR3 regulatory axis in cisplatin insensitivity: A Reduction of FAM83B mRNA and FGFR3 mRNA expression in endometrioid (MDAH-2774) and clear-cell (TOV-21G) ovarian cancer cell lines after LDLR-knockdown (shLDLR). B Tumor-suppressive effect of cisplatin (6 mg/kg/mice) in xenograft mouse models.
Chang et al., ERC (2020), doi: 10.1530/ERC-19-0095
Through multiomics analysis of transcriptome and lipidome data, this study identified the mechanism underlying reduced chemosensitivity in ovarian cancers with high LDLR expression. This finding may inform the development of future therapeutic strategies for ovarian cancer patients.
From insulin to liver metabolism
Insulin, a hormone produced by the pancreas, typically regulates blood glucose levels and certain metabolic processes. Disruption of insulin function – through deficiency, sensitivity, and/or resistance – is the basis of metabolic disorders known as diabetes. In type II diabetes, which comprises the vast majority of cases, the body progressively loses its sensitivity to insulin until it is resistant to the hormone. In the remaining cases, known as type I diabetes, the body stops producing insulin, leading to hormone deficiency.

Study design schematic: Graphical outline of the multiomics study of long-term consequences of insulin-deficient diabetes for the liver.
Backman & Flenkenthaler et al., MolMet (2019), doi: 10.1016/j.molmet.2019.05.011
The molecular pathology of uncontrolled type I diabetes has not been fully characterized, hindering the development of effective interventions. To overcome this obstacle, a 2019 study molecularly characterized metabolism in the liver during insulin deficiency as in type I diabetes.
In pigs engineered to mimic type I diabetes, the transcriptome, proteome, lipidome, and metabolome of liver tissue were analyzed and compared to those from wild-type animals.
 in comparison with wild-type pigs (dashed line). Error bars represent the standard error of the mean.")
Lipid class abundance changes between wild-type and diabetic pigs: Relative abundances of lipid classes in liver tissue of diabetic pigs (blue bars) in comparison with wild-type pigs (dashed line). Error bars represent the standard error of the mean.
Backman & Flenkenthaler et al., MolMet (2019), doi: 10.1016/j.molmet.2019.05.011
Individual analysis of the transcriptome and proteome datasets showed that many metabolic processes – including amino acid metabolism, gluconeogenesis/glycolysis, and ketogenesis – are upregulated in diabetic pigs. These observations are consistent with insulin’s function as a negative regulator of metabolism in the liver. Subsequent multiomics analysis of these two datasets identified molecules involved in these changes.
Individual analysis of the lipidome and metabolome datasets corroborated the observation that insulin deficiency alters metabolism in the liver. For example, the increased abundance of long-chain acylcarnitines in the lipidome is evidence for upregulated ketogenesis in diabetic pigs; and changes in amino acid ratios in the metabolome can be credited to upregulated gluconeogenesis.

Multiomics analysis of transcriptome, proteome, lipidome, and metabolome data, showed that insulin deficiency upregulates many metabolic processes in the liver. These results serve as a resource for future type I diabetes research and may inform disease management strategies.
Risk scores for individual CVDs
Cardiovascular diseases, a collection of conditions associated with a diminished capacity to move blood throughout the body, are the leading cause of death worldwide, according to the World Health Organization. Cardiovascular diseases include stroke, arrhythmia, heart failure, and other conditions; collectively, these conditions can be exacerbated by genetics, poor nutrition, lack of exercise, metabolic obesity, and other factors.
Cardiovascular diseases are often diagnosed and monitored through measurement of lipids like cholesterol and triglycerides in the plasma. However, these metrics fail to distinguish between specific cardiovascular diseases, which has motivated a search for more precise biomarkers.

Leading causes of death globally: In 2019, the 10 leading causes of death accounted for 55% of all deaths worldwide. Cardiovascular diseases are highlighted in green.
WHO Global Health Estimates, World Health Organization (2019), www.who.int
Scientists hypothesize that further characterization of the plasma lipidome – the source of the existing biomarkers – may reveal associations between specific lipids and cardiovascular disease counterparts. To test this hypothesis, a 2019 report explored the relationships between the plasma lipidome, genotypes, and cardiovascular disease phenotypes.
This population study characterized the genotype, plasma lipidome, and cardiovascular disease phenotype of 2181 individuals from the EUFAM and FINRISK biobanks.

Heritability of lipidomic profiles and genetic correlations among the lipid species: A Median heritability estimates in each lipid class. B Heritability estimates based on selected fatty acid chains in lipid species.
Rubina Tabassum et al., Nature Communications (2019), doi: 10.1038/s41467-019-11954-8
Multiomics analysis of genotype and lipidome data revealed 2817 associations between single-nucleotide polymorphisms (SNPs) – a common heritable genetic variation – and the presence of specific lipid species in the blood. This analysis both corroborated known gene-lipid relationships and identified new ones.
In a subsequent multiomics analysis, these gene-lipid associations were compared to cardiovascular disease phenotypes. The approach revealed 10 gene-lipid associations that correlate with cardiovascular disease phenotypes. For example, SNPs in the gene GLTPD2 were linked to reduced plasma sphingomyelin levels and risk of atherosclerosis; additionally, SNPs in SPTLC3 altered total ceramide levels and reduced the probability of intracerebral hemorrhage.

Relationship between lipid-associated variants and cardiovascular diseases: Shown are selected associations of the identified genetic variants (SNPs) with the strongest associated lipid (species), and the relationship between the identified variants with cardiovascular disease phenotypes as odds ratios. Highlighted in red color are associations significant at FDR <0.05.
Rubina Tabassum et al., Nature Communications (2019), doi: 10.1038/s41467-019-11954-8
The multiomics analysis of genotype, lipidome, and phenotype data, in this study showed that certain plasma lipid levels are both heritable and related to an individual’s risk for specific cardiovascular diseases. These results may support the development of more precise diagnostic tools for cardiovascular diseases.
Why multiomics analysis
Multiomics analysis of the lipidome and other biological data can reveal molecular pathways, identify biomarkers, and improve predictions of physiological and pathological processes. Future applications of this emerging technique may help resolve open biological and clinical questions.


Lipotype Lipidomics technology can be used to characterize the lipid profile of primary patient samples, tissue from model organisms, and in vitro samples. These data can provide insight on a wide variety of diseases, including neurodegeneration, cancers, cardiovascular diseases, and metabolic disorders.
Related articles

CRISPR/Cas9-based gene knockouts allow for a better understanding of lipid metabolic pathways.
Learn more
Lipid profiling differentiates between metabolically healthy and unhealthy obesity.
Learn more
Application of a moisturizing body lotion to dry skin improves barrier properties and alters ceramide profile and skin microbiome.
Learn more