

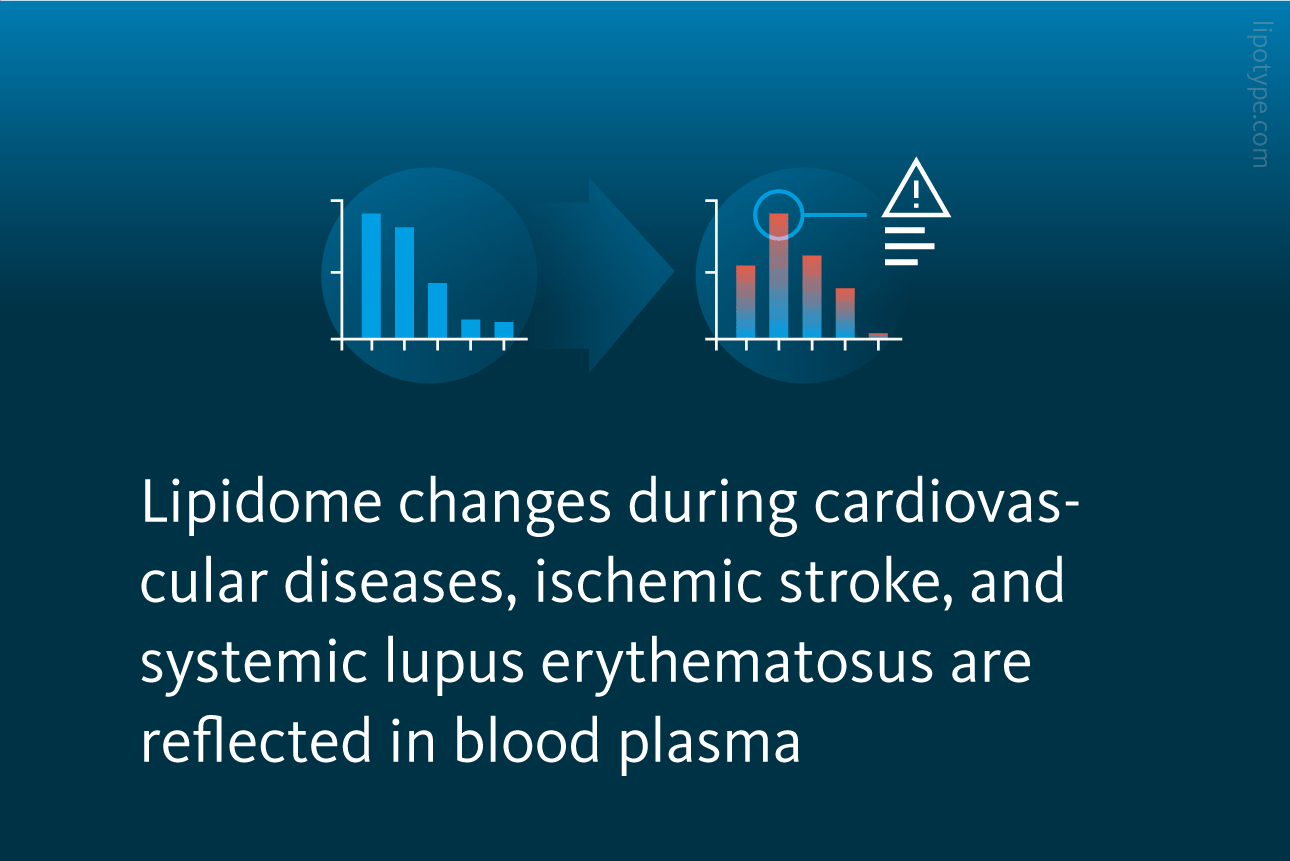
THE presence of particular metabolic diseases, such as diabetes or obesity, as well as dietary preferences and particular medication intake – all these factors are reflected in the plasma lipidome. As lipids play an essential role in inflammatory regulation, it is reasonable to expect that the presence of chronic inflammatory diseases, such as cardiovascular or autoimmune diseases, alter the plasma lipidome, and therefore could be detected with lipidomics analysis.

Matthiesen and Vieira studied the specifics of lipidome profiles in the blood plasma of patients with cardiovascular diseases and ischemic stroke, as well as systemic lupus erythematosus. For their population health study, they analyzed the blood plasma of a cohort of 427 individuals, including the control group, with shotgun lipidomics technology. This allowed for the detection, identification, and quantification of 596 lipids. In each case, control groups were adjusted by age to experimental groups. The goal of the study was to find out if the lipidome profiles of cardiovascular diseases (CVD) and ischemic stroke (IS), and their various manifestations, are different from one another, and how distinct these changes are from the profiles of another chronic inflammation disease – systemic lupus erythematosus (SLE).
 group, 21 to the ischemic stroke (IS) group, and 104 to the systemic lupus erythematosus (SLE) group. Sample acquisition was followed by shotgun mass spectrometry lipidomics analysis of obtained samples, lipid identification and quantification, and data analysis.")
The study design overview: Total of 427 patients participated in the study, with 85 belonging to the control group, 217 to the cardiovascular disease (CVD) group, 21 to the ischemic stroke (IS) group, and 104 to the systemic lupus erythematosus (SLE) group. Sample acquisition was followed by shotgun mass spectrometry lipidomics analysis of obtained samples, lipid identification and quantification, and data analysis.
Matthiesen et al., EBioMedicine 70 (2021) 103504, 10.1016/j.ebiom.2021.103504
The analysis of the acquired dataset included several machine learning techniques, such as supervised and unsupervised analyses. While supervised machine learning relies on labeled input and output training datasets, unsupervised methods rely on unlabeled datasets.
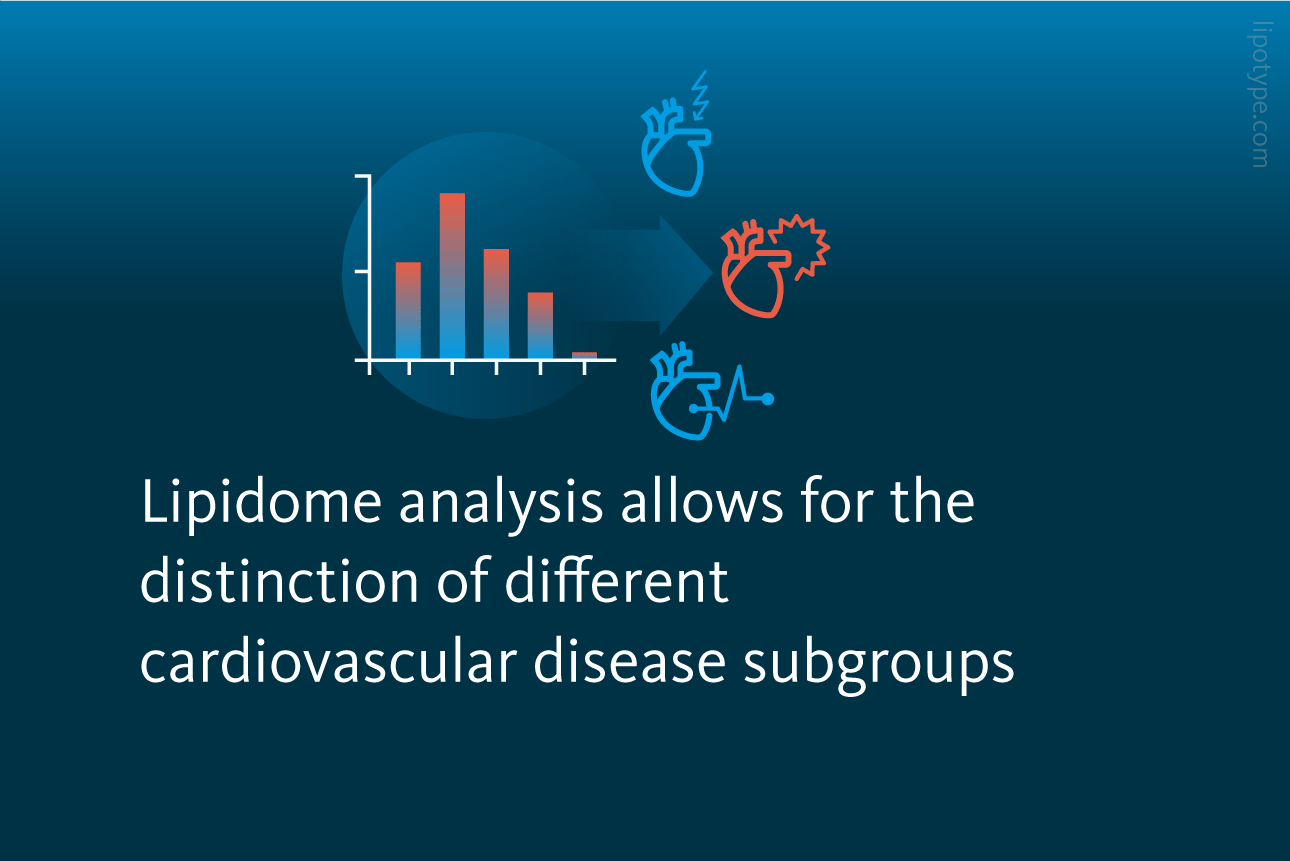
For unsupervised analysis, the principal component analysis (PCA) was used, and a reasonable separation between age-matched controls and IS, CVD1, CVD2, CVD3, CVD4, and CVD5 was achieved. While CVD3 showed the poorest separation from controls, CVD4 and CVD5 showed almost complete separation, suggesting that lipid abundances correlate with the disease presence.
 using all 596 selected lipids as input. A: IS vs control (n=46), B: CVD1 vs control_50 (n=101), C: CVD2 vs control_50 (n=110), D: CVD3 vs control_50 (n=48), E: CVD4 vs control_50 (n=73), and F: CVD5 vs control_50 (n=55).")
Principal component analysis (PCA) using all 596 selected lipids as input: A IS vs control (n=46), B CVD1 vs control_50 (n=101), C CVD2 vs control_50 (n=110), D CVD3 vs control_50 (n=48), E CVD4 vs control_50 (n=73), and F CVD5 vs control_50 (n=55).
Matthiesen et al., EBioMedicine 70 (2021) 103504, 10.1016/j.ebiom.2021.103504
Further, the associations of lipid profiles with various cardiovascular diseases, ischemic stroke and SLE were studied. The Venn comparisons were made with significantly up- or downregulated lipids (at least two-fold) and various groups of cardiovascular diseases. The heatmap indicates the direction of changes, as well as the lipid species. Interestingly, the direction of changes in dysregulated lipids in the CVD, IS and SLE groups is very similar. For example, various cholesteryl esters were upregulated, while phosphatidylcholines and triacylglycerols were downregulated.

Significantly regulated lipids within various groups of diseases: A Venn diagram depicting significantly regulated lipids between CVD subgroups. B Heatmap visualizing the direction of significantly upregulated and downregulated lipids in different disease groups and in CVD subgroups.
Matthiesen et al., EBioMedicine 70 (2021) 103504, 10.1016/j.ebiom.2021.103504
The supervised machine learning method was applied to the lipid profiles and data indicating the belonging of an individual patient to a particular cardiovascular disease group, ischemic stroke group or systemic lupus erythematosus group.
Supervised analysis was performed using linear discriminant analysis (LDA) based on the lipid abundances. It showed a clear separation of control, SLE, and IS groups from the large cluster of cardiovascular diseases. Within the CVD group the subgroups were fairly separated when analyzed together with SLE and IS. Better separation of CVD subgroups was achieved upon the analysis of controls and CVD group only. The first LDA component confidently separated controls from the SLE group, as well as controls from the IS group.

Separation of different disease groups and CVD subgroups by LDA based on pre-selected lipids: A LDA plot visualizing separation of IS, SLE, various subgroups od CVD, and control group. B LDA plot visualizing separation of CVD subgroups and control group.
Matthiesen et al., EBioMedicine 70 (2021) 103504, 10.1016/j.ebiom.2021.103504
Both, the PCA and LDA analyses results suggested building and testing partial least squares (PLS) classifiers. Several of them were created and tested on independent test set. Classification performance based on a set of lipids showed promising results for CVD versus control (sensitivity 0.942, specificity 0.875, and accuracy 0.94), IS versus control (sensitivity 1, specificity 1, accuracy 1), SLE versus control (sensitivity 1, specificity 0.925, accuracy 0.951). The separation between different CVD groups was overall over 0.80, varying on the particular subgroup.

Classification performance for comparison of control and CVD subgroups: The heatmap visualizing the classification accuracy for CVD1 to CVD5 differentiation.
Matthiesen et al., EBioMedicine 70 (2021) 103504, 10.1016/j.ebiom.2021.103504
This study showed that mass spectrometry analysis of plasma lipids is not only a promising tool for differential diagnosis of various atherosclerosis-related vascular diseases, such as cardiovascular diseases and ischemic stroke. Additionally, plasma lipidome can be used to predict risk for cardiovascular diseases and diabetes.

Lipotype Lipidomics technology can be used to characterize the lipid profiles of whole blood as well as blood plasma and other fractions. These data can be used to monitor the lipidome changes associated with atherosclerosis-related chronic inflammatory diseases, and cardiovascular diseases, such as heart failure, as well as in combination with genomics data for a multiomics analysis of cardiovascular diseases.
Do our methods apply to your samples?
Let’s figure that out!

Lipotype products are provided for Research Use Only. They are not intended for clinical diagnostic purposes and must not be used to inform medical treatment decisions. The content of this article is for scientific and educational purposes only and should not be considered medical advice.